Press
to
and click on the empty workspace to add an "Input
image" function. In the Image Window
parameter the default [Actual window] appears,
so the input will be the top Image Window by the time
of pipeline execution. Change this parameter to the caption of
the Image Window to perform the pipeline on specific
Image Window. This parameter can be also used to
specify a Multi-Dimensiona lOpen dialog to receive
input image from. Use the Description tab to
toggle between the parameter list and the description of the
function.
Press
to
and click on the empty workspace to add a "Get Linked
Channel" function.
Drag the "Get Linked Channel" function by
keeping the left button pressed and drop on the "Input
image".
Repeat steps 4-5 once more.
Click the first "Get Linked Channel". Set
the Channel (W) to 1 on the right.
Click the second "Get Linked Channel". Set
the Channel (W) to 2 on the right.
Optionally, rename the "Get Linked
Channel" functions to the actual channel names or
numbers. For
this click once the caption of the function and then keep the
pointer steady over the text. Rename the function from left to
right as 1 and 2.
Press
to
and click on an empty workspace area to add a "Subtract
Background" function. In its parameter list select
"Mean of pixels below percentile of max projection" as Type,
because this is the most accurate method. Set 10-50 percentile
as Value, depending on how much background area do the
recordings have.
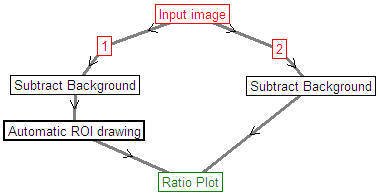
Drag the "Subtract Background" function by
keeping the left button pressed and drop on the "1".
Right-click the "Subtract Background"
function copy, and paste in an empty workspace area.
Drag the second "Subtract Background" function by
keeping the left button pressed and drop on the "2".
Press
to
and click on an empty workspace area to add a "Ratio
Plot" function.
Drag the "Ratio Plot" function by
keeping the left button pressed and drop first on the "Automatic
ROI drawing" function, then on the right side "Subtract
Background" function. In this way channel 1 will be the
numerator and channel 2 the denominator. Inputs can be reordered
by dropping "Ratio Plot" function in the
opposite order or by reordering inputs by clicking them in the
property list.
Open Excel Data window using the Main Menu/Tools/Excel Data
Window to collect data. Alternatively plots can be exported to
text files by setting the Save name property of
"Ratio Plot" to =$LoadName$.txt and Save to
Yes. See automatic file naming conventions by selecting the
Description tab.
Press
to execute the pipeline on the top Image Window. Use
in the main toolbar to repeat this pipeline.
If using Multi-Dimensional Open dialog and have
multiple stage positions, press
to execute the pipeline in all or a subset of positions.