Thresholding and
Binarization
Use the Segmentation/
 Threshold
function to:
Threshold
function to:
- binarize the image (set it black or white, binary)
- ceiling or bottom the image (discard values larger or
smaller than a certain value)
- mask images directly, or use the binarized images for
masking.
Binarized images consist of 32bit floating point
pixels values, as any other image in Image Analyst MKII, but the
actual pixel values are 1 or 0. In contrast image masks
are using pixel value 'MASK' which is a non-numerical floating point
value (e.g. result of 0/0).
The
Threshold
function offers the following methods of thresholding (see
illustration below):
- For non-locally adaptive thresholding:
- The Threshold from local max/min
is None
- The Threshold value calculation method
is:
- Pixel Value: a uniform
threshold is applied to all images
- Percentile by frames: the
thresholding is adaptive, but uniform within each image.
The level is calculated as the given percentile of the
intensity histogram of each image.
- Percentile by series: the
thresholding is adaptive, but uniform within whole image
series. The level is calculated as the given percentile
of the intensity histogram of the image series.
- Otsu by frames: the thresholding is
adaptive, but uniform within each image. The level is
calculated as the Otsu optimal threshold level for each
image.
- Otsu by series: the thresholding is
adaptive, but uniform within whole image series. The
level is calculated as the Otsu optimal threshold level
for the complete image series.
- For locally adaptive thresholding:
- The Threshold value calculation method
is one of the above, but the calculated threshold value is
used in a different way, based on the settings below:
- The Threshold from local max/min
is:
- Bound Maxima uniformly: each object
(part of the image) which is brighter than its
surroundings by the above calculated threshold value,
will be white (1). The surroundings will be black (0).
Practically the threshold value is applied downwards
from the local maximum. The Determine
boundaries at is normally set to zero.
This value is added the threshold value when determining
the boundaries of an object, so increase this value to
get thicker objects.
- Bound Maxima locally: each object
(part of the image) which is brighter than its
surroundings by the above calculated threshold value,
will be white (1). The surroundings will be black (0).
The boundary of the object will be determined at the
percent of its maximal intensity, given in the
Determine boundaries at parameter.
- Maximum Markers: only the local
maxima are shown as white (1) pixels.
- Bound Minima uniformly, Bound Minima
locally, Minimum Markers: same as above but for
minima. In this case set Way
to Below.
Ways of thresholding:
- Above: sets pixels with greater or equal
value than the (local) threshold to white (1), and the rest to
black (0)
- Below: sets pixels with smaller or equal
value than the (local) threshold to white (1), and the rest to
black (0)
- Ceiling: sets pixels with greater
value than the threshold to the threshold value, the remaining
pixels are unaffected
- Bottom: sets pixels with smaller
value than the threshold to the threshold value, the remaining
pixels are unaffected
Ceiling or Bottom used together with "Bound ... locally" will
ceiling for maxima and bottom for minima at the local threshold.
Ceiling and bottom are not available for "Bound ... uniformly"
and for "Markers" and Above or Below binarization is performed
instead.
- Mask Above: sets pixels with greater or
equal value than the (local) threshold to MASK value
- Mask Below: sets pixels with smaller or
equal value than the (local) threshold to MASK value
Examples are shown for adaptive and locally adaptive thresholding
of an image with uneven background:
| Image and
parametering of
Threshold |
Cross-section intensities along
the indicated ROI |
Explanation (illustrations) |
 |
 |
|
|
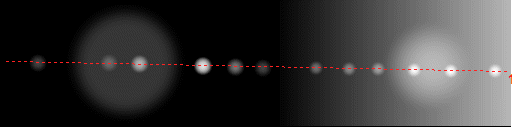
Test image (drawn in Corel PHOTO-PAINT and
saved as 16bit
TIF). Use
Plot/Plot
type=Line Scan to generate
plots.
The result of the binarization using different techniques is
shown below: |
 |
 |
 |
 Thresholding
at an automatically determined level Thresholding
at an automatically determined level |
 |
 |
 |
 Thresholding
from local maxima brighter than the surroundings by 10000
units Thresholding
from local maxima brighter than the surroundings by 10000
units |
 |
 |
 |
 Thresholding
from local maxima maxima brighter than the surroundings by
30000 units Thresholding
from local maxima maxima brighter than the surroundings by
30000 units |
 |
 |
 |
 Thresholding
from local maxima maxima brighter than the surroundings by
10000 units, calculating the threshold for each object at
the 50% of peak intensity (as compared to the global
minimum). Thresholding
from local maxima maxima brighter than the surroundings by
10000 units, calculating the threshold for each object at
the 50% of peak intensity (as compared to the global
minimum). |