Recently a novel image processing technique has been introduced for measurement of mitochondrial swelling in cell cultures expressing mitochondrially targeted fluorescent proteins1. This technique quantifies the relative contribution of fluorescence intensities of thinner and thicker punctate or filamentous structures to the complete image using 2D DFT filtering with a set of two band pass spatial filters (see also band pass filtering here). The quantification is done by the calculation of the ratio of fluorescence intensities in a high frequency bandpass (HBP) over a low frequency bandpass (LBP) filtered copy of the same image (B). The filters are generated by a numerical optimization algorithm (D) to maximize the sensitivity (C) of the technique for the morphological change depicted by the calibration image sets (A; in this case Bax foci formation). Therefore we denote this procedure generally as “Ratiometric Optimized Spatial Filtering Technique”. The resultant fraction is the Thinness Ratio (TR) when referring to the diameter change during mitochondrial swelling, or alternatively, Punctate over Diffuse Ratio (PDR≡TR) to emphasize the subcellular aggregate formation e.g. during Bax-foci formation2. Make distinction between the PDR and the Punctate over Diffuse Index (PDI), the latter is the ratio of variance or standard deviation over mean intensity.
Image Analyst MKII has the full, standalone implementation of
the
ratiometric optimized spatial filtering technique, the
optimization can be accessed from the Tools/Setup DFT Filter
Dialog Optimize tab.
Filtering is performed using the Pipeline to execute the HBP and LBP
![]() 2D
DFT Butterworth Filters.
2D
DFT Butterworth Filters.
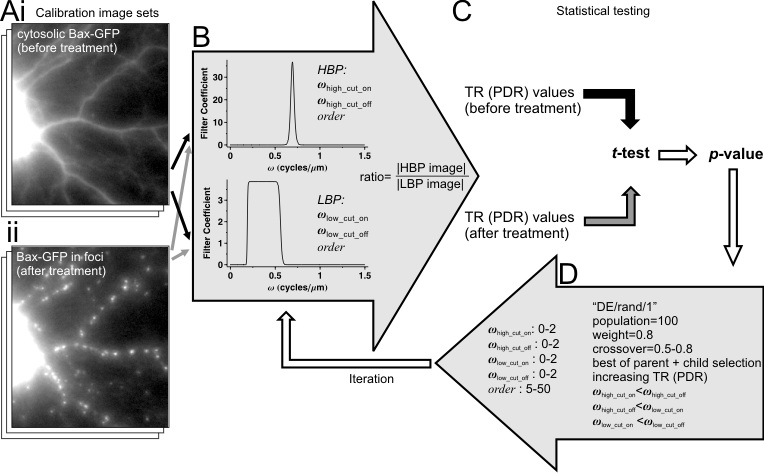 |
| Ratiometric optimized spatial filtering technique. (A) The inputs of the optimization algorithm are two image sequences: (i) control (before treatment) images (e.g. 3 frames from a time lapse) and after treatment frames (ii) depicting the expected biological change, i.e. Bax foci formation. (B) Both (Ai and ii) image sequences are processed by the TR (PDR) algorithm. To this end separate copies of images are filtered with a high frequency band pass (HBP) and a low frequency band pass (LBP) spatial filters. “Corrected Integral” normalized filters are shown, which were optimized for the Bax foci test image sets shown in (A). The TR or PDR is given by the ratio of intensities measured in the absolute value calculated HBP over the LBP images. (C) The TR (or PDR) values calculated from each frame of the control and the treated image sequences are statistically compared using Student’s t-test. (D) The optimization is done by a differential evolution algorithm. The algorithm sets the indicated parameters of the HBP and LBP filters in (B). The goal of the optimization is to minimize the p-value resulted by the t-test in (C). |
Reference List
1. Gerencser, A. A.; Doczi, J.; Töröcsik, B.; Bossy-Wetzel, E.; Adam-Vizi, V. Biophys J 2008, Sep;95(5):2583-98
2. Yuan, H.; Gerencser, A. A.; Liot, G.; Lipton, S. A.; Ellisman, M.; Perkins, G. A.; Bossy-Wetzel, E. Cell Death.Differ. 2007, 14, 462-71.