The relationship between Fourier domain and space domain
Gray scale images are
considered as being composed by superposition of two-dimensional
(2D) sine waves. The spatial frequency or
Fourier domain
representation of an image gives the amplitude (intensity) and phase
(where does the sine wave start) of individual sine wave components
as a function of direction and spatial frequency (w).
The discrete Fourier
transformation converts spatial domain data into frequency
domain data (e.g. B-G ii to i or H to I below), while
the inverse
discrete Fourier
transformation (the real part of the transform) converts
frequency domain data back to spatial domain.
The Fourier domain comprises of complex numbers, and during
visualization the absolute value of these complex values is shown.
The ‘1’ here therefore means amplitude of 1 and phase of zero (the
phase is the argument of the complex number). For better
visualization the origin is placed (both for space and Fourier
domain images) into the center of the images below.
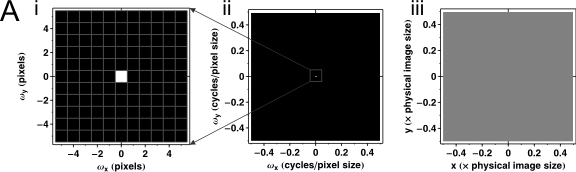
(A) The origin of the Fourier domain
corresponds to the mean intensity of the image.
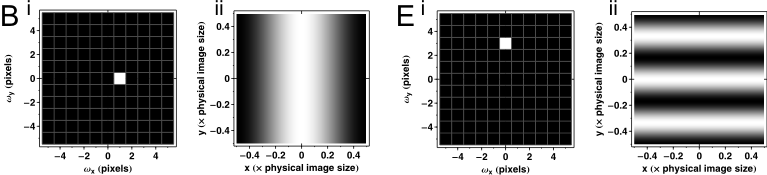
(B-D) Single pixels of the Fourier domain
correspond to different spatial sine waves; the frequency of the
sine wave (i.e. how many times does the sine repeats across the
image) equals to the absolute coordinate of the ‘1’ pixel in the
Fourier domain.
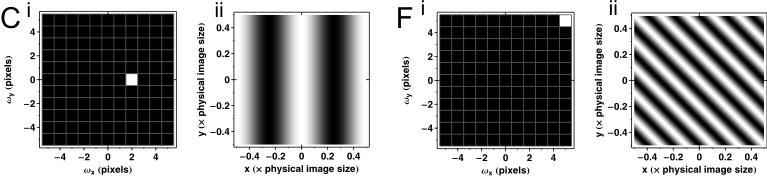
(F) The angle of the sine waves correspond to the
position (angle) of the ‘1’ pixel compared to the origin of the
Fourier domain.
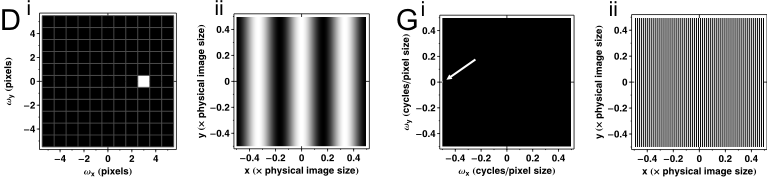
(G) When placing the origin in the middle, the 128
pixels are scaled between -64 and 63, so the maximal spatial
frequency is reached only at -64, resulting a line by line black and
white striped spatial image
|
|
|
The relationship between
Fourier domain and space domain.
(A-G)
Fourier domain images were generated as 128´128
pixel blank (0) images with Mathematica 5.2, and the
indicated pixel was set to 1. (A) The origin of the
Fourier domain corresponds to the mean intensity of
the image. (i) The middle 11´11
pixel region of the 128´128
Fourier domain (ii) is shown. (ii) Space domain, the uniform
gray value represents 1/128 intensity corresponding to the
single pixel set to 1 in (i & ii). (B-F) The middle 11´11
pixel region of the Fourier domain (i) and the space domain
(ii) are shown. (G) The 128128
Fourier domain (i) and the space domain (ii) are shown.
(B-G ii) the amplitude (the maximal intensity corresponding
to white) in the spatial images is 1/128.
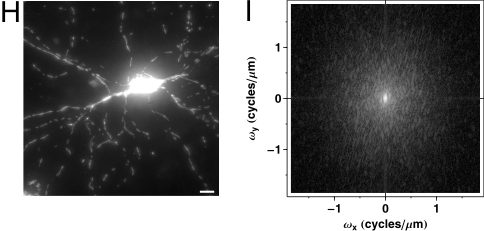
(H) Maximum intensity projected
wide-field fluorescence micrograph of a mito-DsRed2
expressing neuron, a 512´512
image, scaled at 0.27
mm/pixel. Scale bar, 10
mm (I) The Fourier domain of image (H), shown
in a logarithmic scale for better visibility. |
Fourier domain image
representations were generated by Mathematica (Wolfram Research).