![]()
This protocol describes how to conduct a mitochondrial reactive oxygen species (ROS) measurement in adherent cells using fluorescence microscopy of MitoSOX (TPP-dihydroethidium) and image analysis in Image Analyst MKII. ROS levels are expressed as endpoint fluorescence intensity of oxidized MitoSOX normalized to MitoTracker Deep Red and gated to exclude background, debris and dead cells. This is an endpoint assay therefore it is well suitable for imaging entire microplates. The protocol is applicable to fluorescence microscopes capable of low-light level, time-lapse imaging. The normalization cancels the effects of differing cell size, density, geometry, and partially cancels plasma and mitochondrial membrane potential-sensitive MitoSOX accumulation, that are otherwise a major confounding factors of the MitoSOX assay. See the double normalization method that completely cancels membrane potential dependence. Disclaimer: even though using the superoxide-specific fluorescence excitation peak of OH-ethidium, and using the described normalization, the technique is not quantitative for superoxide, because of the complexity of the redox chemistry of dihydroethidium (see Zielonka and Kalyanaraman 2010, PMID: 20116425). Note that no blue fluorescence (460nm) emission from not-yet-oxidized MitoSOX can be detected in contrast to DHE, therefore the normalization cannot be performed as simply as for DHE.
Image Analyst MKII supports this assay with background subtraction algorithms for low light level imaging, image registration, background masking, ROI graphing and rate calculations. These functionalities are integrated into a single, click-and-run pipeline specialized for this assay.
Equipment
Microscopy requirement:
The assay works with wide-field (epifluorescence) and confocal microscopy. The epifluorescence microscope has to be capable of low-light level time lapse imaging, e.g. equipped with a fast shutter and a sensitive monochromatic camera. Confocal microscopes trivially work in low-light level mode. The image acquisition software must record accurate time stamps for optional rate calculation as 1/s. The assay protocol is given assuming that wide field microscopy and assay automation is used to capture multiple conditions in the same time.
Wide field microscopy:
Filter set: (notably, emission peaks are broad and other similar filters may work as well. This table also contains optional components)
| Filter | Spectrum (center/bandwidth nm) | Supplier & Cat. # | Note |
| MitoSOX exciter | 543/22 | standard cy3 cube | |
| MitoSOX dichroic | 562 | e.g. Semrock FF409-Di03-25x36 | standard cy3 cube |
| MitoSOX emitter | 588/21 | Semrock FF02-588/21 -25 | or use standard cy3 cube component |
| Standard CY5 cube for MitoTracker Deep Red | e.g. 628/40 -> 692/40 | standard cy5 cube | |
| Standard DAPI cube for Hoechst 33342 | e.g. 390/40 -> 460/80 | standard DAPI cube |
Note that Hoechst will interfere with the 390nm excitation of MitoSOX, therefore the 543 nm excitation of ethidium fluorescence is used.
Confocal microscopy:
Two-photon microscopy:
| Reagent | Stock Concentration | Solvent | Storage | Supplier & Cat. # | Notes |
| Glucose | 1 M | H2O | RT | Sigma | sterile filter |
| MnTMPyP | 20 mM | H2O | -20C | Calbiochem #475872 | multiple freeze thaw is OK |
| MitoSOX Red | 2-4 mM | DMSO | -20C, in anoxic bag | Molecular Probes, #M36008 | freshly dissolve or use within a week |
| MitoTracker Deep Red | 20-100 µM | DMSO | -20C | Molecular Probes, #M22426 | multiple freeze thaw is OK |
| Hoechst 33342 | 10 µg/ml | H2O | -20C | Molecular Probes | multiple freeze thaw is OK |
| IM (imaging medium) | see composition below | H2O | RT or 4C | sterile filter |
Imaging medium (IM):
| Substance | mM |
| NaCl | 120 |
| KCl | 3.5 |
| CaCl2 | 1.8 |
| MgCl2 | 1 |
| KH2PO4 | 0.4 |
| TES | 20 |
| NaHCO3 | 5 |
| Na2SO4 | 1.2 |
Note: Set pH to 7.4 using NaOH at 37ºC. Store medium aliquoted
in 50ml conicals at RT.
Assay protocol (given for LabTek 8-well chamber)
Handling and loading of cell cultures with MitoSOX
Culture cells on optical quality plastic bottom or glass bottom plates with equal density when several cell lines are compared. For robustness cells are recommended at 90% confluence on the plates, attached firmly and flattened down. Cell loss is expected due to washes therefore low cell density is not recommended. A fully confluent culture will prevent accurate background subtraction during data analysis.
In a conical warm up sufficient amount of complete culture medium (e.g. 10ml for an experiment in a LabTek 8-well chambered coverglass, this volume is to allow higher dilution of DMSO-based probes). Optionally use IM, and perform the incubations in non-CO2 incubator below.
Add 2 µM MitoSOX and 10 nM MitoTracker Deep Red to the culture medium. Desired treatments has to be also added at this point to the culture medium.
Replace medium on cells and incubate for 45 min in a cell culture incubator
Meanwhile supplement 10ml IM with the followings, sterile filter and keep it at 37ºC :
BSA 0.4% (can be used with this assay, optionally)
20 µM MnTMPyP
Hoechst 33342, 5 µg/ml
glucose 0 to 25mM depending on the experiment - by default match the composition of the culturing media
Note: MnTMPyP will stop the increase in MitoSOX fluorescence increase, locking the end point fluorescence. Note: that sterile filtering is to remove debris from the medium that may interfere with fluorescence imaging.
Gently aspirate the probe-containing culture medium and replace with supplemented IM.
Transfer the culture to the microscope, and image as soon as the Hoechst staining is complete (nuclei look filled in).
Imaging
Channel setup:
MitoSOX ethidium 543nm->588nm
MitoTracker Deep Red (CY5 cube)
Hoechst 33342 (DAPI cube)
Position setup:
This is an endpoint assay therefore it is well suitable for imaging entire microplates.
Because this is an end point assay, set strong illumination to have good quality images. Image MitoSOX for the first so no illumination of other channels can trigger its oxidation.
Record a single frame in each position, optionally using image tiling.
 |
 |
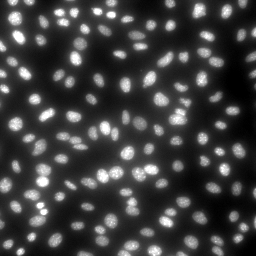 |
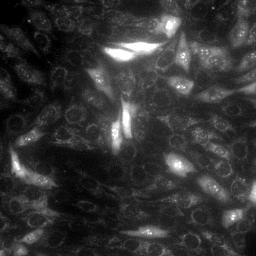
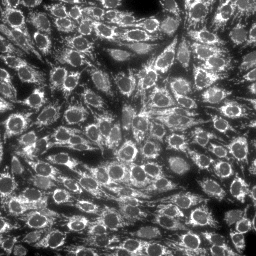
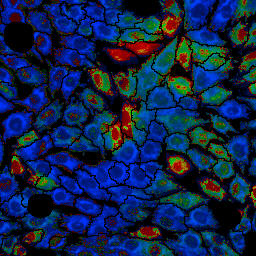
| MitoSOX, MitoTracker Deep Red and Hoechst in stHDH cells (from left to right) | ||
 |
 |
 |
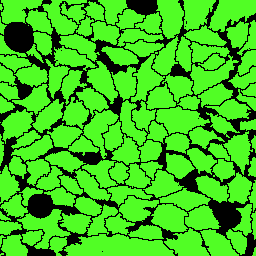
| Dead cell mask based on nucleus brightness, overall mask based on the dead cell mask and segmentation of the MitoTracker image and MitoSOX:MitoTracker Deep Red ratio image (from left to right). Note that the ratio image is only for presentation purposes and the actual result is calculated from the mean fluorescence intensities of MitoSOX and MitoTracker Deep Red. | ||
Image analysis in Image Analyst MKII
Download tutorial image data set from the Tutorials page.
Open the recording (![]() ).
).
Load an image from the recording that with average cell density and amounts of debris and dead cell, that will serve as a positive control for debris gating.
Activate the "MitoSOX MitoTracker Deep Red Ratio End Point POS. CTRL. REFERENCE" pipeline in the Pipelines/Intensity Measurements/Applications main menu point. Note: this pipeline creates reference images for debris gating.
Adjust the pipeline parameters if needed:
Channel Number: Make sure that channel numbers listed here match the actual recording
Background Level (percentile): This must match the setting of the same parameter below
Press
![]() to run pipeline on the loaded image. The created reference
images will be minimized and will persist until closing them by
File/Close All Reference Images. Close the original image
remaining on the screen.
to run pipeline on the loaded image. The created reference
images will be minimized and will persist until closing them by
File/Close All Reference Images. Close the original image
remaining on the screen.
Activate the "MitoSOX MitoTracker Deep Red Ratio End Point" pipeline in the Pipelines/Intensity Measurements/Applications main menu point. Note: this pipeline calculates the MitoSOX and MitoTracker Deep Red average intensities per view field (output channels 1 and 2) and nuclear counts (output channel 3). The images are background is subtracted, and cell-free areas, debris and dead cells are masked. The output is based on the mean fluorescence intensity of all cells in the view field.
Adjust the pipeline parameters:
Channel #: Enter channel numbers were data was recorded
Background Level (percentile): Use a smaller background level (10-30 percentile) for confluent cultures and ~50 percentile for sparse cultures.
Spectral unmix coefficient between MitoSOX and Mitotracker Deep Red: Note: “Spectral Unmixing Coefficient Matrix:” This corrects for the bleedthrough of MTDR into the MitoSOX channel, that is usually very low. To determine spectral crossbleed coefficients use the Tools/Calculate Crossbleed Correction Factor main menu point, or the Math/Blind Spectral Unmix with NMF function. See more on the layout of the Spectral Unmix Coefficient Matrix in the description of Math/Spectral Unmix. Enter MitoSOX as probe/channel #1 and MTDR as probe/channel #2 into the spectral unmix coefficient matrix.
Approximate nucleus diameter (pixels) : Match this value to the visible diameter of nuclei in the Hoechst image. Adjust this value if not all cells are detected.
Dead cell detection threshold (percentile of Hoechst reference image) : It is advised to pick a proper reference image than change this value, but dead cell detection can be sensitized by setting this value below 100%. Dead cells will be masked based on their brighter Hoechst staining.
Maximal diameter of MitoSOX debris to mask: maximal size of object that are debris and not cells.
Minimum cell size (area, pixels) : constrain on the segmented area of the cell covering the MitoTracker stained area
Maximum cell size (area, pixels) : constrain on the segmented area of the cell covering the MitoTracker stained area
MitoTracker detection threshold (% of maximal fluorescence): Only live cells cells accumulate MitoTracker, this sets the sensitivity of including a cell into the analysis.
Export file name for overlay image: Use automatic file naming to save images.
Export file name for ratio image: Use automatic file naming to save images.
Load the images and run the pipeline by pressing
![]() .
Choose to process the the whole multi-position
recording. Note: see a typical
result above.
.
Choose to process the the whole multi-position
recording. Note: see a typical
result above.
In the Excel Data Window:
Plate Ch1 worksheet : average MitoSOX intensity per well
Plate Ch2 worksheet : average MitoTracker Deep Red intensity per well
Plate Ch3 worksheet : live cell counts per well
Finally, calculate the ratio by dividing values in the Plate Ch1 worksheet with the values in the Plate Ch2 worksheet.
Save results in the Excel Data Window using the File/Save Excel Data Window main menu point.
Protocol by Akos A. Gerencser
11/12/2015
V1.0 ![]()
We used this or similar technology in the following papers: