Measurment of mitochondria to cell volume ratio
Note: an updated version of this
protocol is in preparation for LSM780 with Definite
Focus.
Sample preparation, reagents
-
Experimental buffer (EB) in mM:
120 NaCl, 3.5 KCl, 1.3 CaCl2, 1 MgCl2, 0.4
KH2PO4, 5 NaHCO3, 1.2 Na2SO4, 20
TES, 15 glucose , pH7.4 at 37°C
-
Alternatively use full culture
medium and CO2 control during microscopy.
-
Calcein-AM 2mM stock in DMSO
-
Mitotracker Red CMX 100mM stock in DMSO
-
Load cells with calcein-AM 0.5-1
µM
plus Mitotracker Red 25-50 nM for 30 min in EB. Certain cell types
need higher dye concentrations, up to 2-µM calcein-AM plus 100-nM
Mitotracker Red
-
Replace medium over the cultures
with dye-free EB. Image at 37°C or alternatively at RT to
mitigate mitochondrial movement and dye leakage. If calcein
excessively leaks out of the cell, add 500
mM
Na-sulfipyrazone.
Image acquisition with Zeiss LSM
The aim is to record best possible quality, slightly oversampled
images at evenly spaced z-coordinates from the bottom to the top of the
culture. Due to strong photo-toxicity and photo-bleaching it is not
possible to use z-stacking, but
different x,y-coordinates of the culture are scanned for each image.
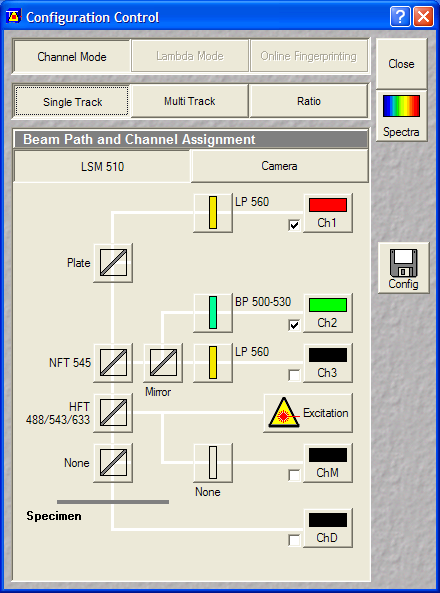
- Microscope Settings (for Zeiss LSM 510):
- Microscope and Configuration Control:
- Lens: Plan-Apochromat 100x/1.4 Oil
- Single track:
- Calcein: 488->500-530 (Ch2)
- Mitotracker Red: 543->560LP (Ch1)
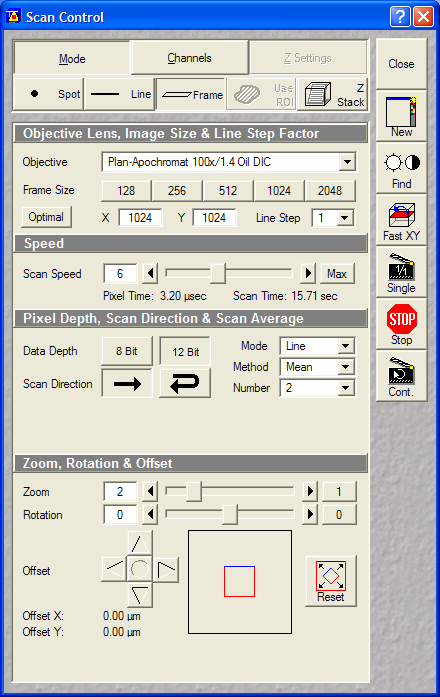
- Scan Control:
- Optical Zoom: 2x
- Pixel size: ~0.044um (oversampled, but not that much as
for deconvolution)
Dimensions, scan: 1024x1024, Single plane, 2xLine Average, Scan
Speed 5 or 6
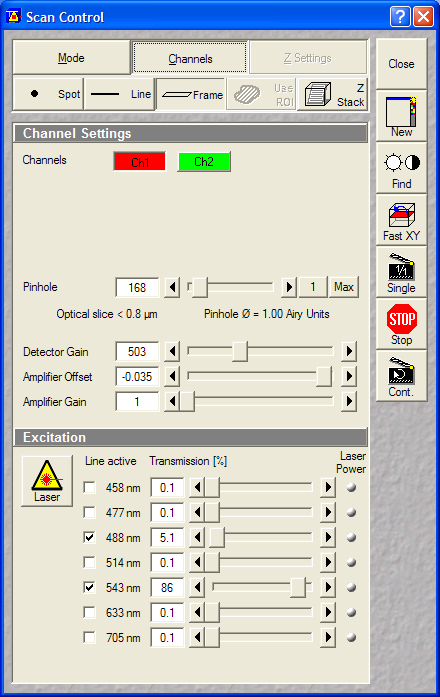
- Pinholes: 1 Airy
- Gains: ~500V
- Data depth: 12 bit
- Laser power: Ar488: ~5-10%; HeNe543:60-100% (increase
gain or laser power as advancing for higher sections, to
keep uniformly bright images. Stronger Ar488 will increase
the crossbleed of calcein into the red channel.) Set the
laser power that a decent quality image is recorded, as the
image is only once acquired, and not z-stacking is used, it
is OK if the view field is bleached / photodamaged after
recording.
- Manual image acquisition:
- Using fast XY scan focus to the bottom of the
cells, acquire one frame. Always acquire only once one specific
view field, the applied laser intensity damages the cells.
- Acquire two more bottom plane frames in
different areas.
- Using fast XY scan focus to the bottom of the
cells, the use the stage control dialog to raise the focal plane
by 1 mm.
- Acquire 3 different view fields at this plane.
To advance between fields use arbitrary number of turns of the
fine stage control knob and do not align cells to the view
field, to avoid biasing the amount of nucleosol/cytosol present in
the images (unless whole cells can always fit into the view
field in a sparse culture).
- Repeat point 3 until getting to the top of the cell
culture. Different cell types need different z-step size,
look for the cell layer thickness, and record 5-7 planes.
- Laser intensities and gains may be increased by
advancing in z. If image becomes noisy decrease Scan Speed
to 5.
- Use the range indicator. DO NOT SATURATE IMAGES! (when
having multiple cell types, non-interesting details can be
saturated)
- Automated image acquisition (requiring the Multi Time
Lapse module of the Zeiss LSM software)
- In multi time series module erase all coordinates an set parameters
(Edit Locations / Import From Stage Control).
- (Autofocus and
configuration Multi Tracks, Autofocus range 90, Offset 0 (does not matter)
- Store lower right corner of each well where the culture is nice.
- In Edit Locations set 60um x 60um and 7 x 5 positions and press Multi Grid
- Go to first position and switch back and forth between Fixed Location and
multiple locations to copy parameters to the newly set locations.
- Use the Store/Apply button to Store parameters into registry under the name of “VolumeRatio”.
- Adjust volumeratio.xls to same length (number of wells x 35) as the number of
locations and copy columns into volumeratio.reg. Save it and double click to
enter it into the registry. Offset decreases upwards. The zero is too high to
start, check it specifically in the actual dish.
- Use the Store/Apply button to Apply parameters into registry under the name of “VolumeRatio”.
- Set image database, file name, tweak laser intensities (and save configuration)
- Start Time.
Analysis in Image Analyst MKII
Use Image Analyst MKII to determine areas corresponding to
mitochondria and the whole cell by using adaptive thresholding.
This protocol assumes that the user is familiar with the
following sections of the online manual:
Protocol
- Load the lsm files corresponding to the serial sections of
one sample by sorting in Windows Explorer according to Time,
multiple selecting and dropping on the Image Analyst.
- For cortical neurons pre-process as follows ("volumeratio
preprocess confocal mask and unmix.ips", the steps of the
pipeline are
detailed below, use the
 to run the pipeline and proceed to the next step):
-
 Threshold:
Mask above Pixel value = 4095 (Threshold from local
max/min=None) both images before unmixing, if there were
saturated areas.
Threshold:
Mask above Pixel value = 4095 (Threshold from local
max/min=None) both images before unmixing, if there were
saturated areas.
-
Subtract
Background: at 5 percentile per frame
-
Blind
Spectral Unmixing with NMF: perform automatic unmixing.
The UnmixNFM matrix have to be defined in the
Preferences/Convolution kernels first as {{1,0.2},{0.01,1}}
meaning that we expect mostly calcein crossbleed into the
Mitotracker channel.
-
Inprint
Mask: holes created by masking are filled in with this
function.
- When the pipeline finished running close the copied calcein
image, and keep working with the unmixed Mitotracker and the
non-unmixed calcein image.
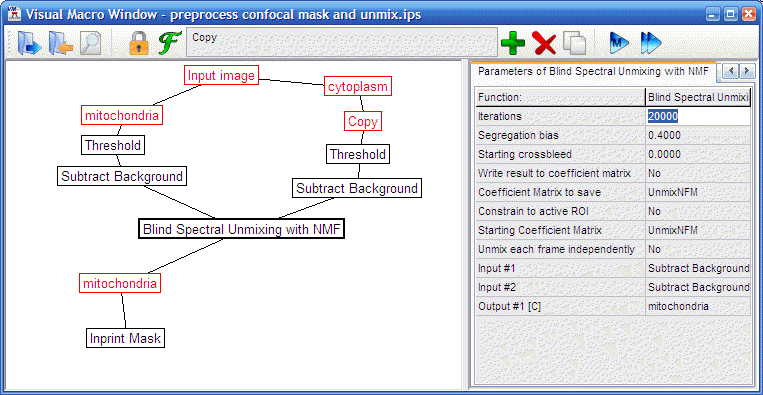 |
"volumeratio preprocess confocal
mask and unmix.ips"
 |
- If the culture is uniform, proceed to next step. If the the
mitochondrial volume ratio in a certain cell type is to be
measured in a mixed culture:
- Work with the calcein image performing the processing
steps below by hand:
-
Subtract
Background: at 5 percentile per frame
-
Threshold:
Bottom at Pixel value = 0 (Threshold from local
max/min=None).
- For each frame of the calcein image draw ROI and perform
Apply
ROI mask by Outside/0/Current frame only=Yes. Mask only
the calcein image.
- Save ROIs for later use.
- If previously drawn ROIs are loaded the image set can be
masked by advancing frames by -> and ROIs by > and repeating
the
Apply
ROI mask for each frame
- Process the unmixed Mitotracker and masked or original
calcein image with the Pipeline “volumeratio process
confocal cortical-masked.ips” (the steps of the pipeline are detailed
below, use the
to run the pipeline and proceed to the next step):
- The Calcein image is processed as follows:
- Wiener
Filter Smooth: adaptive filter for noise removal.
Mask width=5, Noise level=0.01. Increase noise
level for greater noise suppression or decrease if details
are smudged.
-
Set
scaling/color and
Write
back scaled values: values between 1-90 percentile of
each frame is mapped between 0 and 1000 for each frame, so
the new intensities in each of the frames will be similar.
-
Threshold:
Mask below Pixel value = 1 (Threshold from local
max/min=None): this re-masks the area originally masked when
selecting for the cells of interest, so these areas will not
contribute into the threshold calculation in the next step:
- Threshold:
Above Otsu by frames at 1 (Threshold from local
max/min=None): this is an adaptive, but uniform threshold
for each frame.
- The Mitotracker Red image is processed as
follows:
-
Set
scaling/color and
Write
back scaled values: values between 0-99.99 percentile
of each frame is mapped between 0 and 4095 for each frame,
so the new intensities in each of the frames will be
similar.
-
2D
DFT Butterworth BP filter:
80/1.5/2000/100/pixels/.../absolute=No : this is a highpass
filter with a cuton at 80 pixels spatial frequency to show
mitochondria only. Note that if the resolution of image
acquisition is changed a different cuton frequency will be
required. See more
here and
here.
-
Threshold:
Bottom at Pixel value = 0 (Threshold from local
max/min=None): this removes negative values created by the
high pass filter.
-
Wiener
Filter Smooth: adaptive filter for noise removal. Mask
width=3, Noise level=0.01. Increase noise
level for greater noise suppression or decrease if details
are smudged.
-
Image
Arithmetic: the filtered Mitotracker image is masked with the
cytosolic area
-
Set
scaling/color and
Write
back scaled values: values between 0-99.5 percentile of
the whole image series resulting brighter images and
saturation of the brightest pixels. The 99.5 is an
important empirical value which sets the sensitivity of the
method.
-
Threshold:
Mask below Pixel value = 100 (Threshold from local
max/min=None): this suppresses background. Increase this
value if mitochondria look overflowing.
-
Threshold:
Above Otsu by frames at 1, Threshold from local
max/min=Bound Maxima Locally, Determine boundaries at 10(%).
This performs the actual locally adaptive thresholding
outlining close to the zero crossings of the highpass
filtered mitochondrial profiles, therefore reflecting the
width of the original fluorescence objects at half maximal
intensities, thus the physical size of the mitochondria.
- Finally the area of the white (1) pixels is measured by
drawing or loading a big ROI encircling the whole the whole
image
Plot
ROIs/ Plot type=Sum.
- Copy Y Data Only by right clicking
the plots and paste it into Excel. Sum the mitochondrial and the
cytosolic pixels and take their ratio. Multiply the ratio with
0.667 correction factor.
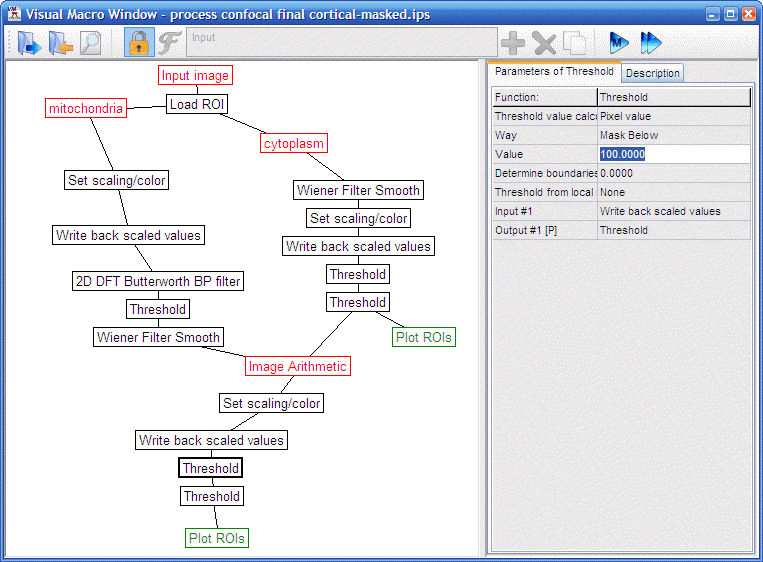 |
“volumeratio
process confocal cortical-masked.ips”
This pipeline was
tuned to provide similar results as the EM-.
 |
|
 |
 |
 |
 |
| Original
Mitotracker Red image. Shown at 25% zoom. Click to see
in original size. |
Original calcein
image. Shown at 25% zoom. Click to see in original size. |
Hand-masked calcein
image |
binarized calcein
image
2.26E+05 pixels |
 |
 |
 |
|
| Unmixed Mitotracker
Red image |
Highpass filtered
Mitotracker Red image |
Binarized, masked
Mitotracker Red image
52581 pixels |
|
- Stereologic correction factor
The factor KV=0.667 derives from the
stereologic correction formula for spheres with equal thickness to
the section and truncated at half maximal intensity. Since
mitochondria are thinner than the optical thickness, they are
blurred by definition to the size of optical thickness, therefore
the thickness of mitochondria equals to the section thickness. The
correction formula (Weibel and Paumgartner 1978), where g is the
relative section thickness, which is 1 (see above).
r is the
relative smallest visible cap section, which is 1 where objects are
clipped at half maximal intensity. Therefore KV=2/3.
Cells are a lot thicker than the focal plane therefore no correction
factor applies for the calcein channel.

Protocol by Akos A. Gerencser 02/11/2010
updated 01/30/2014 V1.1
Who to cite? This technique has been published here:
-
Gerencser AA, Chinopoulos C, Birket MJ,
Jastroch M, Vitelli C, Nicholls DG, Brand MD. Quantitative
measurement of mitochondrial membrane potential in cultured
cells: calcium-induced de- and hyperpolarization of neuronal
mitochondria. J Physiol. 2012 Jun 15;590(Pt 12):2845-71.
We used this technology in the following
papers:
-
Birket MJ, Casini S, Kosmidis G, Elliott
DA, Gerencser AA, Baartscheer A, Schumacher C, Mastroberardino
PG, Elefanty AG, Stanley EG, Mummery CL. PGC-1α and Reactive
Oxygen Species Regulate Human Embryonic Stem Cell-Derived
Cardiomyocyte Function. Stem Cell Reports. 2013 Dec
12;1(6):560-74.
-
Choi SW, Gerencser AA, Lee DW, Rajagopalan S, Nicholls
DG, Andersen JK & Brand MD. Intrinsic bioenergetic properties and
stress-sensitivity of dopaminergic synaptosomes. J. Neurosci.
2011 Mar 23;31(12):4524-34
-
Birket MJ, Orr AL, Gerencser AA, Madden DT, Vitelli C,
Swistowski A, Brand MD, and Zeng X. A reduction in ATP demand and
mitochondrial activity with neural differentiation of human
embryonic stem cells. Journal of Cell Science, 2011 24:348-58.
Other references:
-
Integrated stereological and biochemical studies on hepatocytic
membranes. II. Correction of section thickness effect on volume and
surface density estimates.
Weibel ER, Paumgartner D.
J Cell Biol. 1978 May;77(2):584-97.