![]()
This protocol describes how to conduct NAD(P)H autofluorescence imaging for subsequent image analysis to separate cytosolic and mitochondrial NAD(P)H autofluorescence and determine their redox status. The selectivity for NADH over NADPH is provided by the FCCP/rotenone calibration, while the mitochondrial selectivity is conferred by image processing. Images can be captured by wide-field or two-photon microscopy, with better results using the latter. This protocol describes two-photon microscopic acquisition, however the image analysis does not depend on the type of microscopy used. A high (or actually band) pass spatial filter is automatically generated using numeric optimization to confer transmission of mitochondrially originated fluorescence and rejection of bulk, cytosolic fluorescence. Optimization of the filter function using a training image sequence, and filtering of all other recordings using the optimized filter are described here. This technology was originally described for selective measurement of mitochondrial [Ca2+] by Gerencser and Adam-Vizi in 2001 and recently applied for mitochondrial autofluorescence by Wiley at al. 2016.
Image Analyst MKII supports this assay with an optimization module for high (band) pass spatial filters, spatial high (band) pass filtering with absolute value calculation and plotting ROI means of filtered fluorescence.
Equipment
Microscopy requirement:
The assay works with wide-field (epifluorescence), and two-photon microscopy. The epifluorescence microscope has to be capable of low-light level time lapse imaging, e.g. equipped with a fast shutter and highest grade, high quantum efficiency cooled monochromatic camera. Two-photon microscopes trivially work in low-light level mode.
Wide-field microscopy:
340nm excitation and 460/80nm emission
UV lens, oil or glycerol immersion
Use coverglass bottomed culture dishes on an inverted microscope
Heated environment chamber or heated stage+lens
Two-photon microscopy:
| Reagent | Stock Concentration | Solvent | Storage | Supplier & Cat. # | Notes |
| pyruvate | 1M | IM | fresh from solid | Na-pyruvate does not need pH-ing | |
| lactate | 1M | IM | fresh from solid | Na-lactate does not need pH-ing | |
| rotenone | 5 mM | DMSO | -20C | ||
| FCCP | 10 mM | Ethanol | -20C | ||
| IM (imaging medium) | see composition below | H2O | RT or 4C | sterile filter |
Imaging medium (IM):
| Substance | mM |
| NaCl | 120 |
| KCl | 3.5 |
| CaCl2 | 1.8 |
| MgCl2 | 1 |
| KH2PO4 | 0.4 |
| TES | 20 |
| NaHCO3 | 5 |
| Na2SO4 | 1.2 |
Note: Set pH to 7.4 using NaOH at 37ºC . Store medium aliquoted
in 50ml conicals at RT.
Assay protocol (given for d35 dish)
Handling of cell cultures
Culture cells in d35 culture dish.
In a conical warm up sufficient amount of IM (e.g. 20ml)
Supplement the IM with and sterile filter:
glucose 25mM or match the composition of the culturing media
Wash cells 1-2x with IM
Incubate cultures at 37ºC for 15 min prior imaging, on the stage or in a warm air (no CO2) incubator.
Place sample on the microscope. Use 4ml IM in a d35 dish. Wrap parafilm around the lens to prevent evaporation of the medium. If using inverted microscope, use a lid. Alternatively you may use local humidification using an air pump and the water bottle with a tube blowing the humid air over the sample.
Imaging
Image acquisition setup
Record 512x512 or 1024x1024 pixels images at about 0.15-0.2 µm/pixel resolution
Set illumination intensity (laser power) and scan speed to record grainy images, where the pattern of mitochondrial fluorescence is visible, but does not have a strong contrast. Recording high quality images will damage the specimen.
Set 12 or 16 for the bit depth of the recording
Do not saturate detector, use the bottom of the dynamic range. Set appropriately high gain for low light level imaging, but avoid introducing speckles-like noise by using too high gain. Do not control the intensity of the image using the gain, but rather stick to an optimal value below the gain that causes speckle noise, and set the same value for all experiments.
Record frames not more often than in every 30s.
Test-record if fluorescence intensities (and focus) are stable for ~10 frames. If intensities decrease or increase, relieve the stress on the specimen by decreasing illumination or increasing scan speed.
Recording
Record baseline for 5 frames
Add 10mM (final) pyruvate by pipetting 40µl 1M pyruvate into a tube and wash it into the dish (of 4ml IM) using a disposable transfer (Pasteur) pipette, without knocking the specimen.
Record 5 more frames
Add FCCP (4µM) by pipetting 1.6µl 10mM stock into a tube and washing it into the dish (of 4ml IM) using a disposable transfer (Pasteur) pipette, without knocking the specimen.
Record 5 more frames
On a second specimen repeat the experiment using lactate (10mM) followed by rotenone (2µM final) addition.
 |
 |
 |
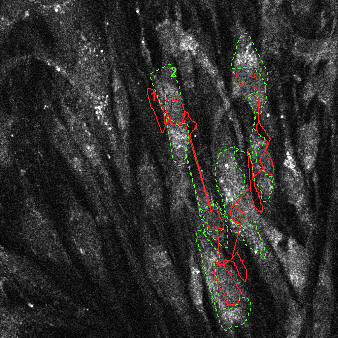
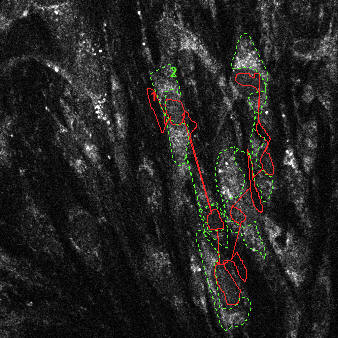
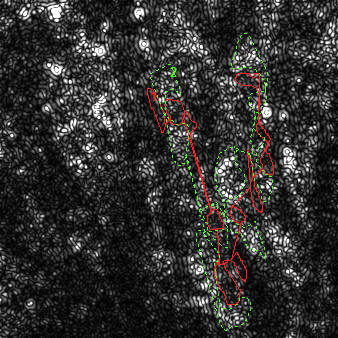
| NAD(P)H autofluorescence at baseline (33% scaled) with transmission (green) and attenuation (red) ROIs indicated | NAD(P)H autofluorescence after pyruvate (33% scaled) with transmission (green) and attenuation (red) ROIs indicated | Raw fluorescence corresponding to the transmission (green) and attenuation (red) ROIs |
 |
 |
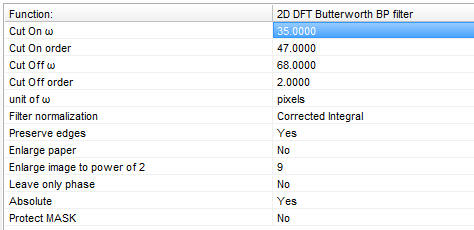  |
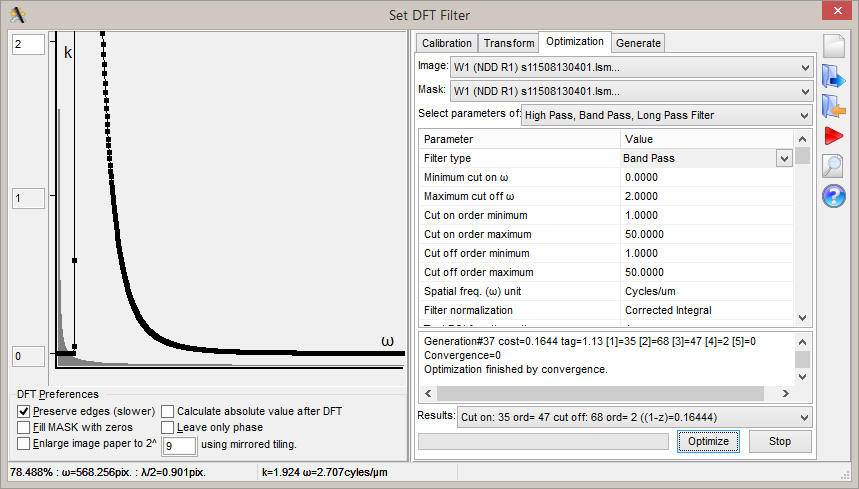
| Setup DFT Filter and Filter Optimizations dialog. When the optimization is done, copy the values from the bottom right corner of the dialog to the main parameter bar when the 2D DFT Butterworth BP filter is selected from the main Filters menu (see right panel) | Filtered NAD(P)H autofluorescence image transmitting only mitochondrial fluorescence | Top:
Parametering of the
Bottom: High pass filtered fluorescence corresponding to the transmission (green) and attenuation (red) ROIs |
Image analysis in Image Analyst MKII
Download tutorial image data set from the Tutorials page. Note that the recorded resolution of the tutorial file is erroneous, it is 0.2um/pixel correctly.
Generating (or training) the high (band) pass filter function using the pyruvate addition recording
The “training” image series depicts a change in the “to be suppressed details”, e.g. a bulk autofluorescence fluorescence change by the oxidation cytosolic NADH. To this end the pyruvate treatment from the above experimental paradigms is used. The training image set should use the same resolution as any other recordings to be analyzed. The pixels size of the training and to be analyzed images should also match, however it is possible to train the filter with a single view field image and analyze a tiled recording using the same frame size.
Open the pyruvate recording (![]() ).
).
If the recording is longer than a baseline
plus treatment (e.g. 5+5 frames) use the
![]() Cut/truncate tool on the main toolbar to shorten it.
Cut/truncate tool on the main toolbar to shorten it.
Circle on ore more nuclei plus some background area around the cells using a single ROI (keep the ROI very thin between nuclei to surround multiple nuclei using a single ROI). Avoid areas close to the edges of the image. Note: including background besides nuclei helps avoiding halo formation around cells by the optimized filter.
Circle mitochondria rich areas of the same cells. Avoid areas close to the edges of the image.
Open the “Setup DFT Filter and Filter Optimizations” from the main Tools menu, while “training” image series is the top Image Window. Using this dialog:
In the Calibration tab set the “Spatial resolution” if it was not correctly determined from the recording.
In the Optimization tab set the Image Window of the training recording as “Image”. Note: flip the tabs to refresh this field if needed.
In the Optimization tab, "Select parameters of" select High Pass, band pass, Long pass Filter. Note: At the same place the Differential Evolution Optimizer may be selected and configured. This protocol uses the default settings of the optimizer. See details on the optimizer here.
Configure the High Pass, band pass, Long pass Filter as follows:
Filter type: Select the filter type. Use “Band Pass” even for high pass filtering applications, because a cut off of high frequency noise components may be needed.
Minimum cut on ω and Maximum cut off ω: The cut on and off ω (spatial frequencies) are given in the units defined below by the “Spatial freq. (ω) unit” property. In general start with 0-2 cycles/µm for mitochondrial applications, or 0-“half of the size of the image” if “Pixels” are selected as unit.
Orders: The useful range of orders is 1-100.
Filter normalization: typically used as Corrected integral.
Test ROIs: Set the # numbers of the attenuation (suppression) and transmission ROIs.
Number of baseline frames: 5 (if following the above protocol, minimum 3)
Number of treatment frames: 5 (if following the above protocol, minimum 3)
Direction of change in transmission ROI: set this to Any, unless you have an apriori knowledge how does mitochondrial fluorescence change during treatment. Then set the direction of the change.
Weight on signal to noise ratio: A higher weight on signal to noise ratio helps to transmit a strong signal for a good readout on the cost of specificity. Zero weight will result loss of signal after filtering.
Absolute: set it to yes, this is required to get meaningful ROI means in high or band pass filtered images.
Preserve edges and Enlarge paper: set them to no. The optimization will be the fastest if the “Preserve edges” and “Enlarge paper” are turned off and the image is quadrangular and sized of power of 2 (e.g. 512x512 or 1024x1024 pixels). If “Preserve edges” is off make sure that the ROIs are not close to the edge of the image. If the image is not quadrangular and sized of power of 2 it is advised to crop it or use the "Enlarge paper" function by setting the "Enlarge to 2^" value to 9 for images smaller than 512 pixels, or 10 or 11 for images smaller than 1024 and 2048 pixels respectively.
Press “Optimize” and observe if convergence on a specific set of filter coefficients occurs.
If the optimization ends with "Optimization finished by convergence." message below the parameters proceed to point #7 below.
If no convergence occurs, adjust ROIs, the “Weight on signal to noise ratio”, or narrow the boundaries of the optimization if the optimization gets lost in too low or too high frequencies.
Copy the parameters from the Results field in the bottom of the dialog to the desired 2D DFT Butterworth BP filter (Filters Main menu) as follows. Note: the spatial frequency (ω) unit of the results is pixels.
Set the unit of the ![]() 2D
DFT Butterworth BP filter or the
2D
DFT Butterworth BP filter or the ![]() 2D DFT Butterworth BP filter tiled
(Filters Main menu) to “Pixels”.
2D DFT Butterworth BP filter tiled
(Filters Main menu) to “Pixels”.
Set values of the “Cut On ω”, “Cut On order”, “Cut Off ω”, “Cut Off order” in the order as values appears in the “Results” field.
Set the parameters “Absolute” and “Preserve edges” to yes (or use "Enlarge paper" as above described, if needed).
Hint: You may
create a pipeline
containing an Input image and the
![]() 2D
DFT Butterworth BP filter in order to
permanently save the filter coefficients. Parameters entered
in the main parameter bar
are saved for the given user, but any later changes will
overwrite these values.
2D
DFT Butterworth BP filter in order to
permanently save the filter coefficients. Parameters entered
in the main parameter bar
are saved for the given user, but any later changes will
overwrite these values.
Note that because pixels are used as spatial frequency units, the training and all other recordings need to have the same µm/pixel resolution and pixels size.
Filtering image series to separate cytosolic and mitochondrial fluorescence and calculation of NADH/NAD+ redox states
Open any recording (![]() )
acquired using the same resolution and image size.
)
acquired using the same resolution and image size.
Create a copy of
the image using the
![]() (Duplicate) toolbar button by choosing "Not Linked".
This will allow to draw different ROIs on the two copies.
(Duplicate) toolbar button by choosing "Not Linked".
This will allow to draw different ROIs on the two copies.
Filter the copy of using the above configured
![]() 2D
DFT Butterworth BP filter or
pipeline.
Note: if using pipeline, add the copy function
to the pipeline.
2D
DFT Butterworth BP filter or
pipeline.
Note: if using pipeline, add the copy function
to the pipeline.
Draw mitochondrial ROIs
![]() , Excel Data Window from the Tools main menu, and press plot
, Excel Data Window from the Tools main menu, and press plot
![]() in the main toolbar.
in the main toolbar.
Use the original image to draw ROIs over
nuclei to determine NAD(P)H autofluorescence corresponding to
the cytosol,
and press plot
![]() in the main toolbar
in the main toolbar
In Excel working on the saved plot data:
Calculate the Cytosolic NADH/NAD+ redox state using the signal from the nuclear ROIs as (baseline-pyruvate)/(lactate-pyruvate).
Calculate the Mitochondrial NADH/NAD+ redox state using the signal from the nuclear ROIs as (baseline-FCCP)/(rotenone-FCCP).
Protocol by Akos A. Gerencser 01/12/2016
V1.0 ![]()
Who to cite? The theory of the highpass filtering technique has been published here:
This particular protocol was briefly described and used in the following paper:
Wiley CD, Velarde MC, Lecot P, Liu S, Sarnoski EA, Freund A, Shirakawa K, Lim HW, Davis SS, Ramanathan A, Gerencser AA, Verdin E, Campisi J. Mitochondrial Dysfunction Induces Senescence with a Distinct Secretory Phenotype. Cell Metab. 2015 Dec 9 (electronic).