![]()
This protocol describes how to measure the absolute magnitudes and time courses of mitochondrial and plasma membrane potentials in intact cells in adherent cultures. The assay uses fluorescence time-lapse microscopy (epi, confocal or two-photon) to record a time course of tetramethylrhodamine methyl ester (TMRM) and the Molecular Devices FLIPR Plasma Membrane Potential Assay Kit probe (=plasma membrane potential indicator, PMPI) fluorescence. The intact cells are exposed to a calibration paradigm using the reagents described below, and fluorescence responses measured during this challenge are converted into millivolt values using the Membrane Potential Calibration Wizard in Image Analyst MKII.
Equipment
Microscopy requirement:
The assay works with wide field (epifluorescence), confocal and two-photon microscopy. The epifluorescence microscope has to be capable of low-light level time lapse imaging, e.g. equipped with a fast shutter and a sensitive monochromatic camera. Confocal and two-photon microscopes trivially work in low-light level mode. The image acquisition software must record accurate time stamps for each (pairs of TMRM and PMPI) frames.
Wide field microscopy:
Filter sets: a customized filter set achieves better signal to noise ratio because of less correction required for spectral crossbleed. However fluorescence can be captured by standard green (PMPI) and red (TMRM) emission channels. Ideally TMRM emission is collected above 600nm to decrease crossbleed of PMPI.
| Filter | Spectrum (center/bandwidth nm) | Supplier & Cat. # | Note |
| PMPI excit | 500/24 | Semrock FF01-500/24-25 | Standard YFP cube component |
| PMPI dichroic | 520 | Semrock FF520-Di02-25x36 | Standard YFP cube component |
| PMPI emitter | 542/27 | Semrock FF01-542/27-25 | Standard YFP cube component |
| TMRM excit | 580/14 | Semrock FF01-580/14-25 | individual stock filter |
| TMRM dichroic | 594 | Semrock Di02-R594-25x36 | individual stock dichroic |
| TMRM emitter | 641/75 | Semrock FF02-641/75-25 | individual stock filter |
Alternatively use the PMPI exciter and dichroic for both TMRM and PMPI channels to record only using an emission filter wheel. Note: the emission bands of PMPI and TMRM are wide, and other similar filters may work just as well.
Confocal microscopy:
Two-photon microscopy:
Small equipment requirement:
| Reagent | Stock Concentration | Solvent | Storage | Supplier & Cat. # | Notes |
| NaCl | 240 mM | H2O | RT | Sigma | sterile filter |
| KCl | 240 mM | H2O | RT | Sigma | sterile filter |
| KCl | 2 M | H2O | RT | Sigma | |
| CaCl2 | 1 M | H2O | RT | Sigma | sterile filter |
| Glucose | 1 M | H2O | RT | Sigma | sterile filter |
| Glutamine | 200mM (cell culturing) | H2O | -20C | Gibco / Life Technologies | |
| TMRM | 50 µM | DMSO | -20C | Life Technologies | |
| PMPI (plasma membrane potential indicator) | (explorer kit vial dissolved in 10ml H2O) | H2O | -20C | Molecular Devices #R8042 FLIPR Membrane Potential Assay Kit (blue) or #R7291 (red) | The bulk kit is 10x more concentrated. Do not filter. |
| Zosuquidar | 25 mM | DMSO | -20C | MedKoo or Sigma | |
|
IAA-94 |
200 mM | DMSO | -20C | Enzo ALX-550-248-M025 | optional component |
| DIOA | 100 mM | DMSO | -20C | Santa Cruz sc-203230A | optional component |
| Bumetanide | 100 mM | DMSO | -20C | Sigma | optional component |
| TTX (tetrodotoxin) | 1 mM | MES/H2O | -20C | Sigma | optional component, dissolve in 10mM MES |
| Valinomycin | 1 mM | Ethanol | -20C | Sigma | |
| Oligomycin | 10 mg/ml | Ethanol | -20C | Sigma | |
| Antimycin A | 20 mM | Ethanol | -20C | Sigma | Alternatively use myxothiazol |
| Gramicidin | 10 mg/ml | Ethanol | -20C | Sigma | |
| Paraformaldehyde | 8%, see below | H2O | -20C | warm up of filter for precipitates | |
| 2xPM (potentiometeric medium) | see composition below | H2O | RT or 4C | sterile filter |
An abbreviations list is at the end of the document.
2xPM (potentiometric medium)
The 2xPM is a Na-free double concentrated stock solution for composition of the assay medium (potentiometric medium). This is required for a series of mixing steps that ensure constant probe concentrations. The full potentiometric medium is composed in the Assay Protocol section below by mixing the 2xPM with equal amount of NaCl or KCl solutions.
Simple 2xPM:
| Substance | mM (2x of final) |
| KCl | 7 |
| MgCl2 | 2 |
| KH2PO4 | 0.8 |
| TES | 40 |
| NaHCO3 | 10 |
| Na2SO4 | 2.4 |
Set the pH to 7.6 at room temperature using NaOH. Mix an aliquot of 2xPM with 240mM NaCl 1:1, warm up to 37C and adjust the pH with measured amount of HCl or NaOH. Add the required amount to the rest of the 2xPM. Sterile filter and aliquot into 50ml conicals. Store at RT. Note: Don't include CaCl2 into the 2xPM, because calcium phosphate may precipitate.
Cell culture medium-based 2xPM
Custom-order (e.g. from Gibco / Life Technologies) powdered culture medium omitting the following components: NaCl, phenol red, NaHCO3, riboflavin, folic acid, glucose, glutamine and Ca2+ (in any form). Note: mind the final phosphate concentration in light of the final concentration of added CaCl2!
| Substance | mM (2x of final) |
| Custom culture medium powder (w/o NaCl!) | 2x |
| TES | 40 mM |
| NaHCO3 | 10 mM |
Set the pH to 7.6 at room temperature using NaOH or HCl. Mix an aliquot of 2xPM with 240mM NaCl 1:1, warm up to 37C and adjust the pH with measured amount of HCl or NaOH. Add the required amount to the rest of the 2xPM. Steril filter and aliquot into 50ml conicals. Store at RT. Note: Don't include CaCl2 into the 2xPM, because calcium phosphate may precipitate.
Calibration cocktails:
Anti-swelling cocktail (ASC) - optional
| Drug | stock (mM) | Final (uM) | final dilution= | 1000 | volume= | 20 |
| IAA-94 | 200 | 100 | 10 | |||
| DIOA | 100 | 10 | 2 | |||
| Bumetanide | 200 | 80 | 8 | |||
| Add DMSO= | 0 | |||||
Mitochondrial depolarization cocktail (MDC)
| Drug | stock (mM) | Final (uM) | final dilution= | 1000 | volume= | 100 |
| Valinomycin | 1 | 0.50 | 50 | |||
| Oligomycin | 10 | 1 | 10 | |||
| Antimycin A | 20 | 1 | 5 | |||
| Add EtOH= | 35 | |||||
8g paraformaldehyde for 100 ml distilled water
Heat to 60 degrees while stirring. Add drops of 10N NaOH until the solution is transparent (usually 1-4 drops per 100ml sometimes more).
Cool to room temperature.
Adjust to pH 7.4
Filter into aliquot tubes. Store frozen at -20C.
Thaw before use in 65C water bath.
Consumables (for working in LabTek coverglass-bottomed chamber or up to 15 wells of a 96-well plate)
Generic guidelines for fluorescence microscopic recording of mitochondrial membrane potential:
Configuration guidelines for Wide field microscopy::
Configuration guidelines for Confocal microscopy::
Configuration guidelines for Two-photon microscopy :
Prepare potentiometric medium (PM) working solutions (right before the assay, use it on the same day):
In a 15ml conical prepare supplemented 2xPM with the probes:
| Reagent (stock concentration) | amount or concentration in the 2x medium |
| 2xPM | 10 ml |
| CaCl2 (1 M) | 1.5 mM (30 ul) |
| Glucose (1 M) | 6 mM (60 ul) |
| Glutamine (200 mM) | 4 mM (200ul) |
| Zosuquidar (25 mM) | 2 uM (0.8ul) |
| TMRM (50 uM) | 10 nM (4ul) |
| PMPI (explorer kit) | 1:200 (100ul) |
| TPB (1 mM) | 1 uM (20 ul) |
Mix with vortexing.
Save 1ml of this supplemented 2xPM in an 1.5ml tube. Note: a modified culture medium-based 2xPM may form precipitation by time with Ca2+ added. In this case save this 2xPM without Ca2+ added and supplement it before use.
Prepare PMNa: in an other 15 ml conical mix 7ml NaCl (240 mM) and 7ml of the above supplemented 2xPM.
Prepare PMK: in a 2ml tube mix 1ml KCl (240 mM) and 1ml of the above supplemented 2xPM.
Handling of cultures:
Wash cell cultures with PMNa twice. Use 400-500 ul for LabTek 8-well chambered coverglass or 150ul for reduced-area 96-well plate wells.
Incubate in a CO2-free warm air incubator, optionally on rocker for 90min
Replace medium for fresh PMNa and transfer the culture onto the microscope stage and incubate further 30min. Note: keep the culture warm while transferring to the microscope.
Note: All tubes and reservoirs used for handling PMNa need to be pre-soaked in PMNa, because probes may get depleted by absorption on the walls.
Note: The dilution of 2x media stocks was designed to ensure constant probe concentrations around the sample.
Preparations before time-lapse recording:
While the cell culture dish is preincubating on the microscope stage prepare:
Set up acquisition parameters based on the above recommendations (Generic guidelines).
Prepare PMNa-MDC by pipetting 500ul PMNa into a pre-soaked tube and add 1.5ul ASC + 1.5 ul MDC + 1.5ul TTX
Supplement the PMK tube with 2ul ASC + 2ul MDC + 2ul TTX
Mix challenge treatments at 2x concentration with PMNa. If using larger aqueous volumes, e.g. for glucose addition, mix 1M glucose with the supplemented 2xPM at 1:1 resulting a 0.5M glucose stock with identical probe concentration to PMNa. Use this stock to prepare the 2x challenge treatment.
Set the volume in the well to support 1:1 additions, e.g. 200ul in a LabTek 8-well chamber or 100ul in a 96-well plate well.
Time-lapse recording:
Record a baseline of 30 frames. Longer baselines allow better precision and also a test for non-phototoxic conditions. Stop recording after the baseline. Individual recordings will be merged in Image Analyst MKII.
Make the challenge addition by adding the 2x concentrated challenge prepared in PMNa at 1:1, stir well and remove the added volume.
Record challenge for an arbitrary length of time
Add PMNa-MDC at 2:1 volume to the well and stir well.
Quickly start a 20 min recording.
In 3-5 steps add (or replace medium) by increasing amounts of supplemented PMK, e.g. 50,100,150, 200 ul for a Labtek 8-well chamber or 10,20,40,75 for reduced are 96-well plate. The volumes are arbitrary, but note down the initial volume and the additions and removals, these values will be required for the calibration. After each addition wait 1 minute, then record 5 frames.
Prepare PMK-PFA by mixing 440ul 2xPM 60ul 2M KCl and 500ul 8%PFA supplemented with 1ul of 10mg/ml gramicidin
Add PMK-PFA at 1:1
Record for another 20-30 min until PMPI fluorescence stabilizes at a maximum level.
The live-cell time lapse experiment ends here. PMK-PFA fixed samples can be processed for immunocytochemistry with any-colored fluorescence labeling as PMPI and TMRM washes out during premeabilization. If the microscope is equipped with appropriate stage motorization, the same view fields can be re-imaged after staining, to pick specific cell types during analysis.
Data analysis in Image Analyst MKII
The analysis of TMRM/PMPI recordings requires spectral unmixing. See related "Calculation of spectral unmixing coefficients for mitochondrial membrane potential measurement" protocol. The spectral unmixing coefficient matrix qualifies the configuration of the microscope, so it has to be re-measured if the relevant microscope configuration changes, but not for different specimens. The ratio of the two (TMRM and PMPI) exposure times affects the coefficients, but a change exposure time can be accounted for by changing exposure correction parameters in the Spectral Unmixing function by editing the pipeline.
Analysis of the recording:
Open the recording using the File/”Open Image Series/Measurement” or the toolbar button. In the Open Image/Measurement dialog select all recorded files comprising the time lapse. Alternatively use multiple file selection in the Windows Explorer and drag-and-drop on the Image Analyst MKII. Note: check the correct order in the Files tab of the Multi-Dimensional Open dialog.
Select the “Mitochondrial membrane potential measurement (TMRM/PMPI)” pipeline in the Pipelines/”Intensity Measurements”/Applications main menu point.
Configure the pipeline as follows:
Set channel number associations for TMRM and PMPI
Use a smaller background level (10-30 percentile) for confluent cultures and ~50 percentile for sparse cultures. Percentiles below 5-10 may increase noise.
Enter the coefficient matrix as above calculated.
Set cell diameter in pixels. To measure it
open the recording, draw linear ROI across a typical cell
using the
![]() toolbar, and then reading out its length by double-clicking
the status bar of the image to bring up an Image Property
window. (Alternatively use the context menu of the Image
Window).
toolbar, and then reading out its length by double-clicking
the status bar of the image to bring up an Image Property
window. (Alternatively use the context menu of the Image
Window).
If you have previously saved the calibration configuration, enter the file file name into the corresponding pipeline parameter or leave this field blank.
Press the
![]() button
on the main toolbar or in the bottom of the Multi-Dimensional
Open dialog.
button
on the main toolbar or in the bottom of the Multi-Dimensional
Open dialog.
To calibrate PMPI and fluorescence traces to millivolts, either follow the step-by-step configuration of the “Membrane Potential Calibration Wizard” (below) or open the “calibration configuration.ips” configuration file accompanying the image data files.
Press the
 button
to perform the calibration or the
button
to perform the calibration or the
 button to transfer
calibrated potentials to Excel.
button to transfer
calibrated potentials to Excel.
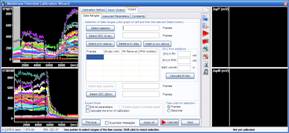
Configuration of the Membrane Potential Calibration Wizard:
Optionally first reset the Membrane Potential Calibration Wizard by pressing the ![]() button.
button.
1. Calibration Method tab:
1.1. Choose the plasma membrane potential calibration method: “Complete with known kP (K-steps)”
1.2. Choose the mitochondrial membrane potential calibration method: “Complete”
2. Input/Output tab: the input images have been already selected by the pipeline.
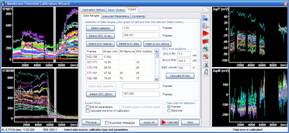
3. Wizard – Data Ranges tab:
3.1. Select baseline by pointing the range in one of the graphs on the left, and press the “Select baseline button”
3.2. Select the recording after addition of PMNa-MDC, thus the complete mitochondrial depolarization, and press the “Select MDC (K-eq)” button.
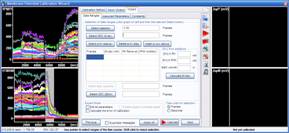
3.3. Select last segment of the recording where PMK-PFA was added, thus the final complete depolarization, and press the “Select CDC (zero)” button.
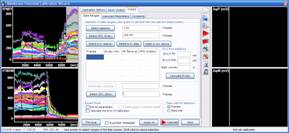
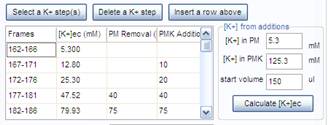
3.4. Select the K+-steps, the end of the PMNa-MDC addition and the number of steps made by supplemented PMK addition or replacement. Press the “Select a K+ step(s)” button.
3.5. To calculate [K+] during K-steps, enter the K+ concentration in the potentiometric medium (PM), in the K-based potentiometric medium (PMK), and the medium volume in the well before starting K+-steps. From the second line of the table, in each line of the table enter values for the arbitrarily made medium removals and PMK additions into the “PM Removal” and “PMK Addition” columns, repsectively. Press the “Calculate [K+]ec button”.
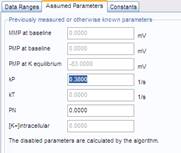
4. Wizard – Assumed Parameters tab: No action is required, use the default rate constant for PMPI redistribution kP=0.38 s-1, and assume no significant non-K-permeability of the plasma membrane during K-steps by using the default PN=0.
5. Wizard – Constants tab: set the cell specific parameters here:
5.1. VF (mitochondrion:cell volume fraction): use the “Mitochondrion:cell volume fractionator” protocol to measure this value using confocal microscopy, or assume it based on literature. Typically between 4 (fibroblasts) - 8 (primary beta cells, neurons) % for cultured mammalian cells.
5.2. VFM (matrix:cell volume fraction): this value affects the results only little (because aR’ –see below- largely cancels its effects). The default is 0.8
5.3. aR’ (apparent activity coefficient ratio): use the “Mitochondrial membrane potential assay - measurement of the apparent activity coefficient ratio” pipeline to calculate this value using confocal microscopy. See protocol here. Typically 0.36 (human beta-cells) - 0.41 (rat neurons).
5.4. Leave all other constants at their default values.
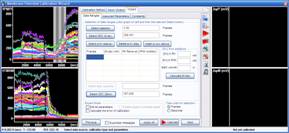
6. Press
the ![]() Calibrate button
to perform the calibration. Note: not
all cells in the view field can be calibrated, therefore error
messages will appear. Press
cancel to see
no more messages, or check “Suppress messages” in the bottom of
the Calibration Wizard.
Calibrate button
to perform the calibration. Note: not
all cells in the view field can be calibrated, therefore error
messages will appear. Press
cancel to see
no more messages, or check “Suppress messages” in the bottom of
the Calibration Wizard.
7. To
save results press ![]() or
right-click /
”Copy Plot Data” in the graphs on the graphs on the
right.
or
right-click /
”Copy Plot Data” in the graphs on the graphs on the
right.
8. To explore the results:
8.1. Use
the ![]() and
and ![]() buttons
to see the regression analysis used to calculate calibration
parameters
buttons
to see the regression analysis used to calculate calibration
parameters
8.2. Use
the ![]() button
to see only the time course preceding the calibration steps.
button
to see only the time course preceding the calibration steps.
8.3. Use
the ![]() button
to see only those plasma membrane traces that also were
successfully calibrated for mitochondrial membrane potential.
Press
button
to see only those plasma membrane traces that also were
successfully calibrated for mitochondrial membrane potential.
Press ![]() again
to refresh the results.
again
to refresh the results.
8.4. Right-click
/ “Calculate Mean” to see mean±SE of
all calibrated traces. To undo mean calculation, press ![]() again. Note: if
the mean calculation is performed on the fluorescence traces on
the left, then the mean data will be calibrated.
again. Note: if
the mean calculation is performed on the fluorescence traces on
the left, then the mean data will be calibrated.
9. Quality control of the calibration:
9.1. Check
“Calculate the error of calibration” in the Data ranges tab
within the Wizard tab and press ![]() .
Now the predicted error of the calibration is shown. Note: optionally,
check the “Suppress messages” on the bottom.
.
Now the predicted error of the calibration is shown. Note: optionally,
check the “Suppress messages” on the bottom.
9.2. Check “Edit all parameters”. Detailed lists of all parameters for PMPI and TMRM calibration, common calibration constants, and error propagation parameters are shown in tabs appearing on the right of the Wizard tab on the top.
9.3. In
the PMPI parameters, set Quality control by propagated error of
baseline to “Yes” and press ![]() .
Traces with larger predicted error than set at the parameter
below disappear now.
.
Traces with larger predicted error than set at the parameter
below disappear now.
9.4. In
the TMRM parameters, set Quality control by propagated error of
baseline to “Yes” and press ![]() .
Traces with larger predicted error than set at the parameter
below disappear now.
.
Traces with larger predicted error than set at the parameter
below disappear now.
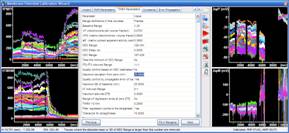
10. Using the Expert Mode: When the Edit all parameters checkbox is checked in the Data ranges tab within the Wizard tab, all parameters of the calibration algorithms can be directly accessed in the tabs appearing on the right of the Wizard tab. These can be used alternatively to the Wizards tab to enter any of the parameters. Use the “Fill in Range(s)” button to automatically enter a range from the selection made in the right graphs.
11. Fine tuning the calibration
11.1. Switch to the “Constants” tab, for this the “Edit all parameters” needs to be checked in the “Wizard” tab.
11.2. To accommodate to the temporal resolution and noise of the recording, adjust the “Differentiation kernel width” to 11 frames. Larger width suppresses noise by providing more smoothing, but also smears fast changes.
11.3. Median filter for baseline, fft0 and fp0: if using the “Take maximum of CDC Range” in the “PMPI Parameters” tab or “Take minimum of CDC Range” in the “TMRM Parameters” use this option to suppress noise affecting minimum and maximum calculations.
12. Automation
12.1. Save
an arbitrary calibration configuration using the ![]() button
in the Membrane Potential Calibration Wizard.
button
in the Membrane Potential Calibration Wizard.
12.2. In the Pipeline Parameters (Main Window Parameter Bar; the “Mitochondrial membrane potential measurement (TMRM/PMPI)” pipeline is activated) click the “Calibration configuration file name (*.ips)” parameter, and click the button appearing at the end of the line. Select the saved calibration file.
12.3. To automate saving the results give a filename in the “Output Excel Data save file name (*.xlsx)” using the string parser, such as =%LoadBaseName%%LoadStageNumber:2%.xlsx. See more about the string parser in the Main menu Help/”Help on Expression Evaluation”. Optionally give a path, or set the default path to be used in the Main menu Files/”Set Folder Locations”.
12.4. Use
the pull down menu of the ![]() button
on the main toolbar or in the bottom of the Multi-Dimensional
Open dialog to select “Run pipeline … on all stage positions” or
“Run pipeline … on partial plate”.
button
on the main toolbar or in the bottom of the Multi-Dimensional
Open dialog to select “Run pipeline … on all stage positions” or
“Run pipeline … on partial plate”.
Abbreviations:
PMPI, plasma membrane potential indicator
TMRM, tetramethylrhodamine methyl ester (mitochondrial membrane
potential indicator)
PM, PMK, PMNa : potentiometric medium, K-based potentiometric
medium, Na-based potentiometric medium
PMP, plasma membrane potential
MMP, mitochondrial membrane potential
MDC, mitochondrial depolarization cocktail
CDC, complete depolarization cocktail
Keq, K+-equilibrium (potential)
PN and PD, sum of the concentration*permeability values of ions
other than K+ in the Goldman (GHK) equation; using relative
permeabilities to K+; N: numerator, D:denominator.
DTE,FTE : rate of TMRM decay, normalized with PMP and TMRM
fluorescence normalized with PMP, used for calculation of
calibration parameters using linear regression.
VF : mitochondria:cell volume fraction
VFM : matrix:mitochondria volume fraction
aR` : apparent activity coefficient ratio, expresses probe
binding to mitochondrial membranes, differences in chemical
activities between the cytosol and the mitochondrial matrix and
the dilution of TMRM fluorescence by the intermembrane space.
RAV : a parameter calculated from VF, VFM and aR`
fP0 and fT0 : fluorescence at zero potentials of PMPI and TMRM,
respectively
fPX and fTX : fluorescence background and high-affinity binding
of PMPI and TMRM, respectively
kP and kT : rate constant of PMPI and TMRM equilibration through
the plasma membrane at zero potential, respectively.
r^2, kPr2, fpxr2, TMRMr2 : r square values of the respective
linear regressions
zTM,zT,zP : the apparent charge of TMRM in the mitochondrial
inner membrane, in the plasma membrane and of PMPI in the plasma
membrane, respectively.
sP,sT : structural parameters of the electrostatic barrier model
for PMPI and TMRM.
Additional keywords: tetramethylrhodamine ethyl ester, TMRE, JC-1, mitochondrial assay, oxidative phosphorylation assay, mitochondrial membrane potential measurement, proton motive force, phosphorylation potential, ATP/ADP
Protocol by Akos A. Gerencser 12/13/2015
V1.2
![]()
minor update (V1.2): 12/13/2015: typos, added links
original date (V1.1): 07/29/2015
Who to cite? The theory of the technique has been published here:
The beta-cell specific application and the Membrane Potential Calibration Wizard was used for the first time here:
Gerencser AA. Bioenergetic Analysis of Single Pancreatic Beta-Cells Indicates an Impaired Metabolic Signature in Type 2 Diabetic Subjects. Endocrinology 2015 Oct;156(10):3496-503
We used this technology also in the following paper: