Measurement of matrix to cytosol apparent activity coefficient ratio for TMRM
This protocol describes how to measure the apparent
affinity coefficient ratio of
tetramethylrhodamine methyl ester (TMRM), that is a required for the calculation of the absolute magnitudes and time courses
of mitochondrial and plasma membrane potentials in intact cells in adherent
cultures. The apparent affinity coefficient ratio describes the binding of TMRM
to mitochondrial membranes and the dilution of fluorescence by
otherwise light microscopically invisible ultrastructural details of
mitochondria (e.g. crista density). This is a confocal microscopic
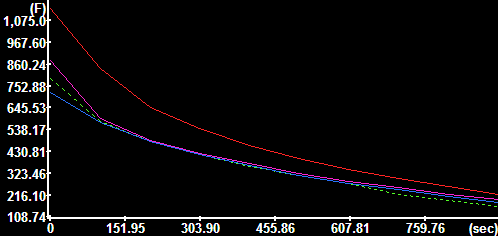
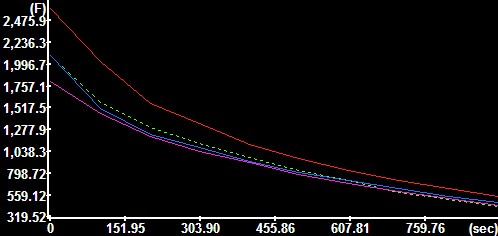
assay. To calculate the apparent affinity coefficient ratio,
confocal microscopic fluorescence time-lapses are recorded to follow
the leakage of TMRM from the cells as mitochondria are being
completely depolarized immediately before the start of the
recording. Then the apparent affinity coefficient ratio is
calculated by a built-in pipeline in Image Analyst MKII.
Sample preparation, reagents
- Experimental buffer (EB): 120 NaCl, 3.5 KCl, 1.3 CaCl2,
1 MgCl2, 0.4 KH2PO4, 5 NaHCO3, 1.2 Na2SO4,
20 TES, 15 glucose , pH7.4 at 37°C
- Mitochondrial depolarization cocktail with FCCP (MDCF):
|
Drug
|
stock (mM)
|
Final concentration (mM)
|
Volume to mix (ml)
|
|
Valinomycin
|
10
|
1
|
10
|
|
Oligomycin
|
10
|
2
|
20
|
|
Myxothiazol
|
20
|
1
|
5
|
|
FCCP
|
10
|
1
|
10
|
|
Add
EtOH=
|
|
|
55
|
- TMRM 100mM stock in ethanol or
methanol
- Load cells with TMRM (50nM) for >90 min in EB (no TPB or
PMPI here).
- The experiment is performed without replacement of the above
medium at 37°C
- Immediately before starting the time lapse add 1:1000 MDCF to
the cultures.
Configuration of image acquisition with Zeiss LSM Multi
Time Series module
The aim is to record a time lapse of 10 frames of decaying TMRM
fluorescence after mitochondria have been completely depolarized by
the addition of MDCF. The images are acquired with identical scanning
settings as during
mitochondria to cell volume
fraction measurement. Here it is
somewhat important to avoid photo-bleaching.
The image acquisition protocol is given for a Zeiss LSM 510 / AIM
system here. Use the
updated volume fractionator protocol as a
guideline for setting the assay up on an LSM780 / Zen / Definite
Focus system. The essence of the configuration detailed below is to
record a time lapse of TMRM fluorescence at 1024x1024 single plane
frames at ~0.044um/pixel resolution, 10 frames at about 1 min/frame
interval.
- Microscope Settings (for Zeiss LSM 510):
- Microscope and Configuration Control:
- Lens: Plan-Apochromat 100x/1.4 Oil DIC
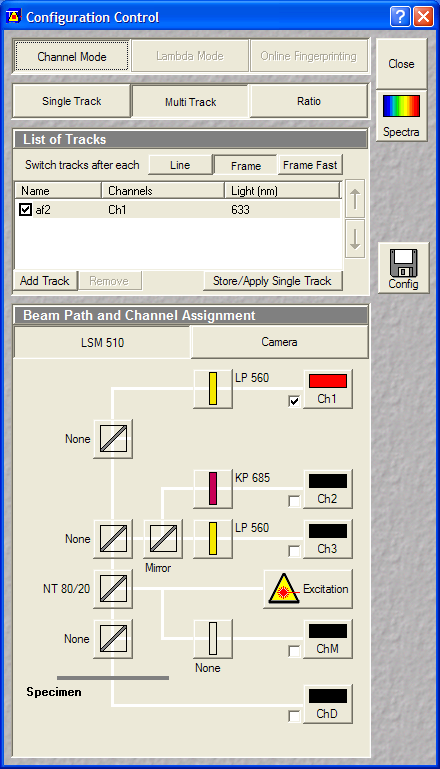
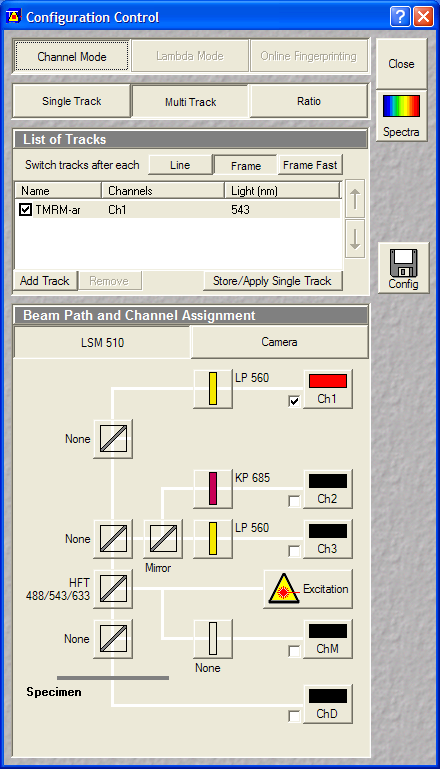
- Multitrack (containing 1 track):
- Mitotracker Red: 543->560LP (Ch1)
- Autofocus track (multitrack with 1 track)
- Use reflected light of HeNe633 laser in Ch1
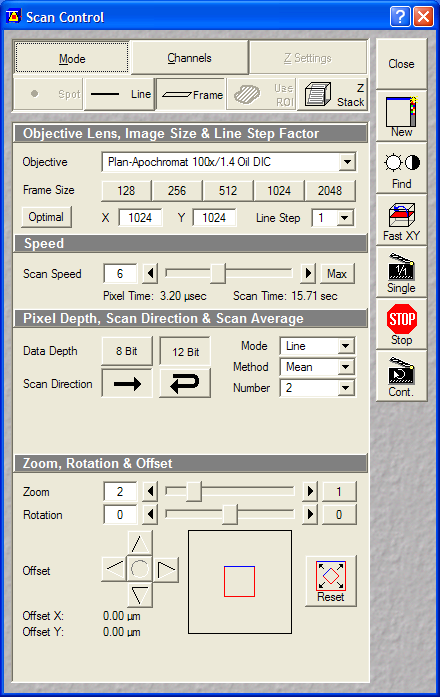
- Scan Control:
- Optical Zoom: 2x
- Pixel size: ~0.044um (oversampled, but not that much as
for deconvolution)
Dimensions, scan: 1024x1024, Single plane, 2xLine Average, Scan
Speed 6
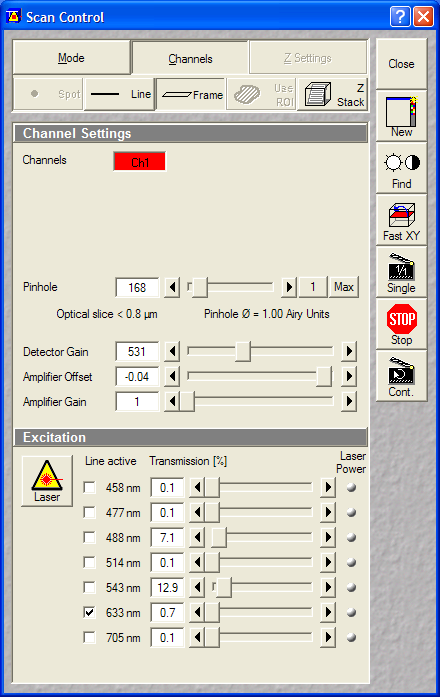
- Pinholes: 1 Airy
- Gain: ~500V
- Data depth: 12 bit
- Laser power: HeNe543:50% (set
gain or laser power before starting time lapse)
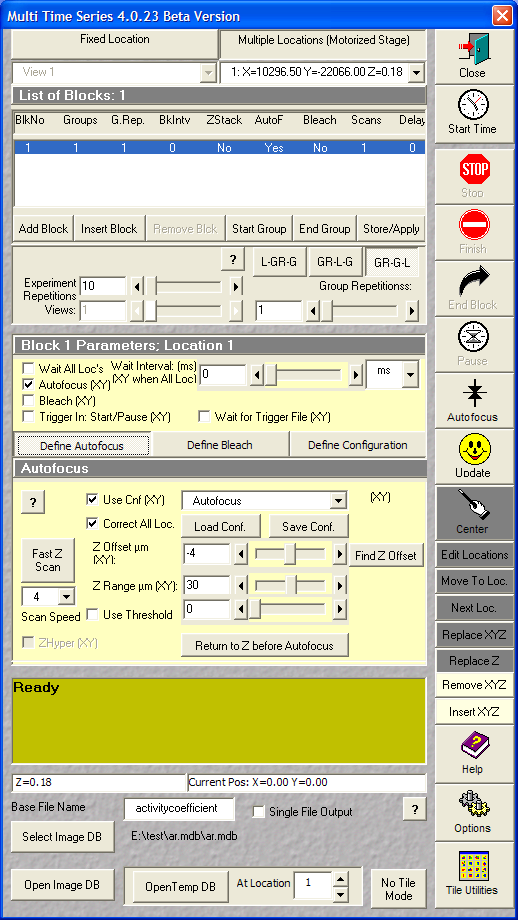
- Multi Time Series module:
- Switch to Fixed Location and set up experiment
parameters:
- Experiment Repetitions: 10
- Autofocus (XY) checked
- Define Autofocus:
- Use Cnf (XY), set the saved multitrack
configuration for autofocus
- Correct All Loc
- Z Range: 30
- Scan speed 4
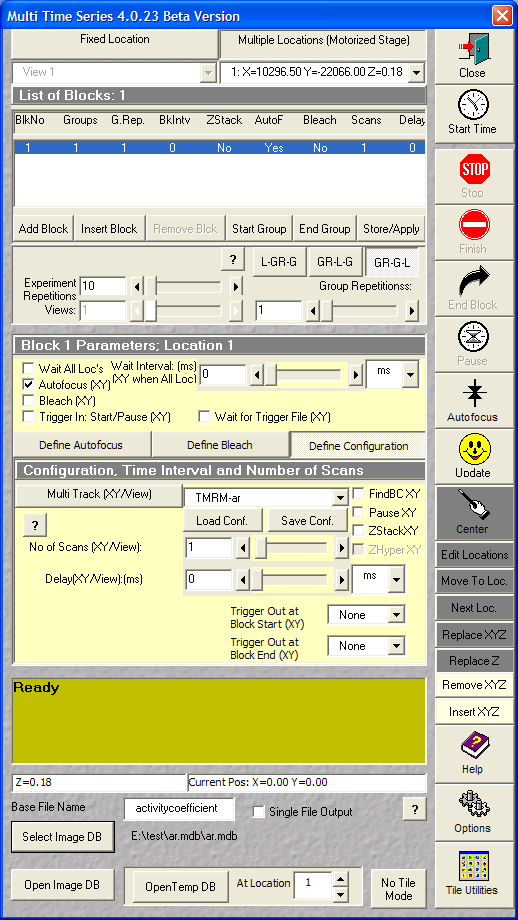
- Define configuration
- set the saved multitrack configuration for TMRM
- No of Scans: 1
- Delay 0
- Switch the microscope to eyepiece / transmitted light
and search for a good position (cell with well visible
nucleus and perinuclear area).
- Switch the Multi Time Series module to Multiple
Locations. This adds the current position to the list.
- Search for 2 more positions and press Insert XYZ after
each.
- Set up autofocus offsets
- In the Define Configuration tab press Load Conf.
- In the Scan Control dialog decrease the 543nm
intensity to ~15%
- Focus and reposition the sample using Fast XY scan.
Focus in the middle of the cell to have a
nuclear region where no out-of-focus mitochondria
appear.
- In the Multi Time Series module press Replace XYZ
and the Find Z Offset.
- Press Next Loc and repeat from point 5.1. Do it for
all positions.
- Select Image DB to save results.
Assay protocol
- Add MDCF at 1:1000 to the culture and mix the medium
well. Points 2-4 serve to adjust illumination parameters in
a Zeiss AIM system.
- In the Define Configuration tab press Load Conf.
- In the Scan Control dialog press single.
- If intensities look fine stop it. If there is saturation
decrease the laser intensity and in the Configuration
Control store the changed configuration
- Start recording by pressing Start Time in in the Multi Time Series module
 |
 |
 |
| Autofocus
settings |
|
|
 |
 |
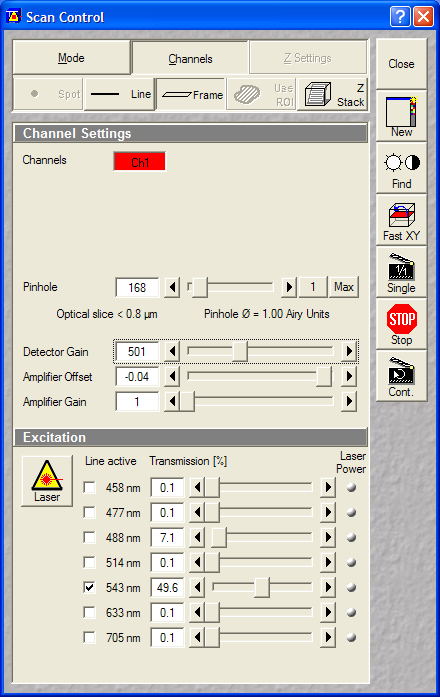 |
| TMRM scan
settings |
These settings (except for the scan
speed, averaging) should be similar to the one used for the
volume ratio measurement. |
Set the Transmission% of the 543nm
before starting time lapse |
 |
 |
|
| Definition of autofocus |
Definition of the TMRM scanning
configuration. The number of frames to record are set at the
experiment repetitions. Use 3 positions and record without
delay between the cycles. |
|
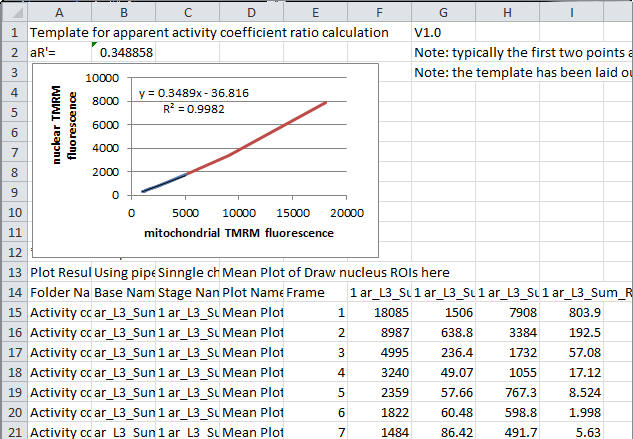
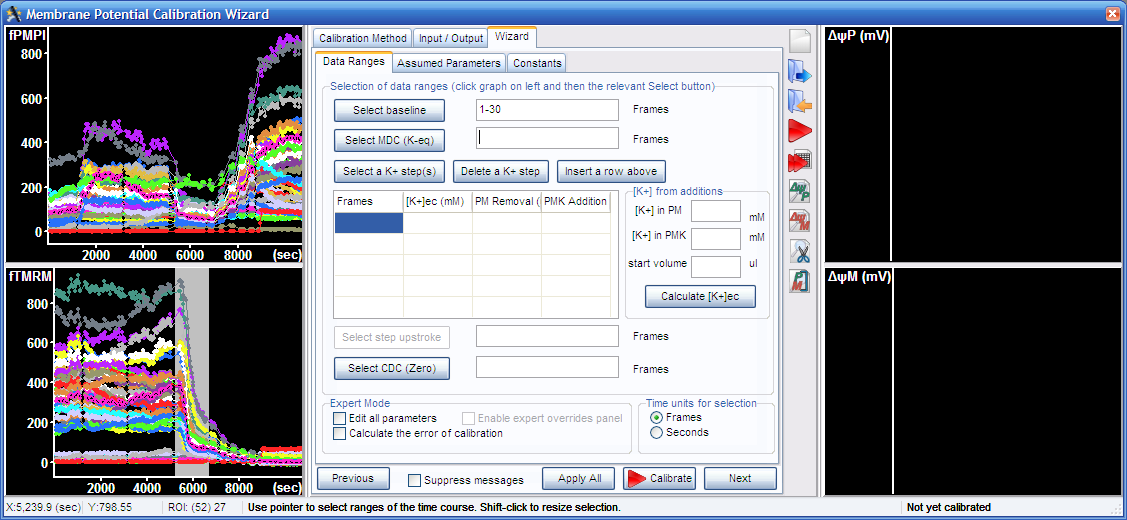
Analysis in Image Analyst MKII (from
version 3.0.0)
Use Image Analyst MKII to determine mitochondria to cytosol
activity coefficient.
Analysis Protocol
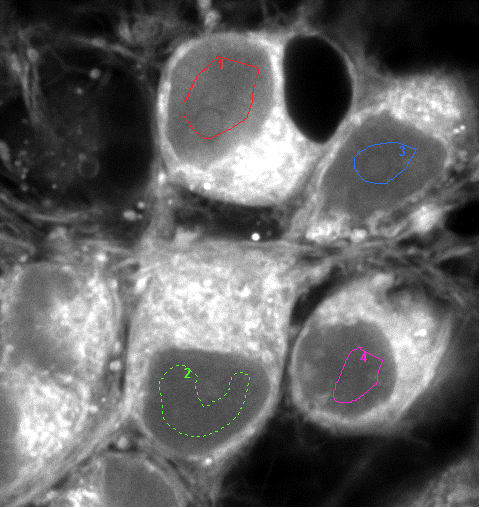
"Draw nucleus ROIs here" Image |
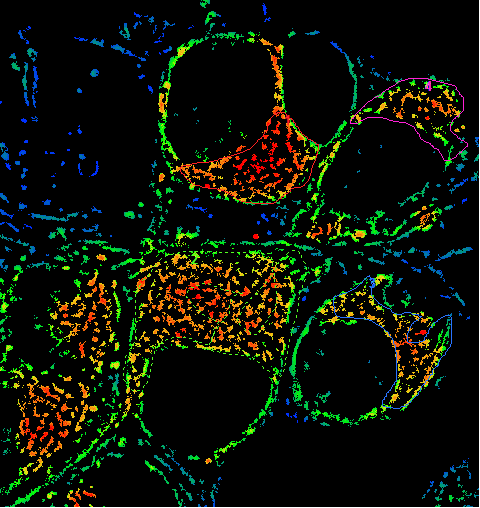
"Draw mitochondrial ROIs here" Image |
|
Nuclear fluorescence |
Mitochondrial fluorescence |
|
 |
|
|
| Contents of the Excel
Data Window |
|
|
Protocol by Akos A. Gerencser 02/11/2010 V2.0 updated 07/29/2015
Who to cite? This technique has been published here:
-
Gerencser AA, Chinopoulos C, Birket MJ,
Jastroch M, Vitelli C, Nicholls DG, Brand MD. Quantitative
measurement of mitochondrial membrane potential in cultured
cells: calcium-induced de- and hyperpolarization of neuronal
mitochondria. J Physiol. 2012 Jun 15;590(Pt 12):2845-71.